Friday, February 26, 2016

Three kinds of warming in the Arctic

The Arctic is prone to suffer from three kinds of warming. Firstly, the Arctic is hit particularly hard by emissions, as discussed in earlier posts such as this one and this one.

Secondly, warming in the Arctic is accelerating due to feedbacks, as discussed on the feedbacks page. Many such feedbacks are related to decline of the snow and ice cover in the Arctic, which is in turn made worse by emissions such as soot.

Thirdly, the most dangerous feedback is release of methane from the Arctic Ocean seafloor, due to hydrates getting destabilized as heat reaches sediments.


Last year, Arctic sea ice reached its maximum extent on February 25, 2015. This year, there was a lot less sea ice in the Arctic on February 25 than there was last year, as illustrated by above image. The difference is about 300,000 square km, more than the size of the United Kingdom.

The image below shows that global sea ice on February 22, 2016, was only 14.22086 million square km in area. It hasn't been that low since satellite records started to measure the sea ice.


A number of feedbacks are associated with the decline of sea ice, such as more sunlight being absorbed by the water, instead of being reflected back into space as it was previously. Furthermore, there are three kinds of warming active in the Arctic, as described above and as depicted by the image below.


Sea ice can reflect as much as 90% of the sunlight back into space. Once the ice has melted away, however, the water of the ocean reflects only 6% of the incoming solar radiation and absorbs the rest. This is depicted in above image as feedback #1.


As Professor Peter Wadhams once calculated, warming due to Arctic snow and ice loss could more than double the net warming now caused by all emissions by all people of the world.

Professor Peter Wadhams on albedo changes in the Arctic, image from Edge of Extinction
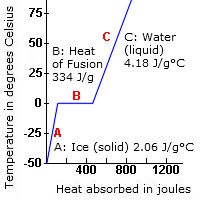
As the sea ice melts, sea surface temperatures will remain at around zero degree Celsius (32°F) for as long as there is ice in the water, since rising ocean heat will first go into melting the ice. Only after the ice has melted will ocean heat start raising the temperature of the water. Sea ice thus acts as a buffer that absorbs heat, preventing water temperatures from rising. As long as sea ice is melting, each gram of ice will take 334 Joule of heat to change into water, while the temperature remains at 0° Celsius or 32° Fahrenheit.

Once all ice has turned into water, all further heat goes into heating up the water. To raise the temperature of one gram of water by one degree Celsius then takes only 4.18 Joule of heat. In other words, melting of the ice absorbs 8 times as much heat as it takes to warm up the same mass of water from zero to 10°C. This is depicted in the image on the right as feedback #14.


Above video, created by Stuart Trupp, shows how added heat at first (A) goes mainly into warming up water that contains ice cubes. From about 38 seconds into the movie, all heat starts going into the transformation of the ice cubes into water, while the temperature of the water doesn't rise (B). More than a minute later, as the ice cubes have melted (C), the temperature of the water starts rising rapidly again.

Methane is a further feedback, depicted as feedback #2 on the image further above. As the water of the Arctic Ocean keeps getting warmer, the danger increases that heat will reach the seafloor where it can trigger release of huge amounts of methane, in an additional feedback loop that will make warming in the Arctic accelerate and escalate into runaway warming.

Sediments underneath the Arctic Ocean hold vast amounts of methane. Just one part of the Arctic Ocean alone, the East Siberian Arctic Shelf (ESAS, see map below), holds up to 1700 Gt of methane. A sudden release of less than 3% of this amount could add 50 Gt of methane to the atmosphere, and experts have warned for many years that they consider such an amount to be ready for release at any time.


Above image gives a simplified picture of the threat, showing that of a total methane burden in the atmosphere of 5 Gt (it is meanwhile higher), 3 Gt that has been added since the 1750s, and this addition is responsible for almost half of all antropogenic global warming. The amount of carbon stored in hydrates globally was in 1992 estimated to be 10,000 Gt (USGS), while a more recent estimate gives a figure of 63,400 Gt (Klauda & Sandler, 2005). Once more, the scary conclusion is that the East Siberian Arctic Shelf (ESAS) alone holds up to 1700 Gt of methane in the form of methane hydrates and free gas contained in sediments, of which 50 Gt is ready for abrupt release at any time.

The warning signs keep getting stronger. Following a peak methane reading of 3096 ppb on February 20, 2016, a reading of 3010 ppb was recorded in the morning of February 25, 2016, at 586 mb (see image below).

Again, this very high level was likely caused by methane originating from the seafloor of the Arctic Ocean, at a location on the Gakkel Ridge just outside the East Siberian Arctic Shelf (ESAS), as discussed in the earlier post. This conclusion is supported by the methane levels at various altitudes over the ESAS, as recorded by both the MetOp-1 and MetOp-2 satellites in the afternoon, as illustrated by the combination image below showing methane levels at 469 mb.


The situation is dire a calls for comprehensive and effective action as described in the Climate Plan.


Links

- Feedbacks in the Arctic
http://arctic-news.blogspot.com/p/feedbacks.html

- Albedo changes in the Arctic
http://arctic-news.blogspot.com/2012/07/albedo-change-in-arctic.html

- The time has come to spread the message
http://arctic-news.blogspot.com/2013/12/the-time-has-come-to-spread-the-message.html

- Greenhouse gas levels and temperatures keep rising
http://arctic-news.blogspot.com/2016/01/greenhouse-gas-levels-and-temperatures-keep-rising.html

- Arctic sea ice area at record low for time of year
http://arctic-news.blogspot.com/2016/01/arctic-sea-ice-area-at-record-low-for-time-of-year.html

- Has maximum sea ice extent already been reached this year?
http://arctic-news.blogspot.com/2016/02/has-maximum-sea-ice-extent-already-been-reached-this-year.html

- Global sea ice extent record minimum - Arctic Sea Ice Blog
http://neven1.typepad.com/blog/2016/02/global-sea-ice-extent-minimum-record.html

- Warming of the Arctic Fueling Extreme Weather
http://arctic-news.blogspot.com/2014/06/warming-of-the-arctic-fueling-extreme-weather.html

- Climate Plan
http://arctic-news.blogspot.com/p/plan.html


Last year, Arctic sea ice reached its maximum extent on February 25, 2015. This year, there's a lot less sea ice in the...
Posted by Sam Carana on Friday, February 26, 2016

Tuesday, February 23, 2016

Arctic Winter Heatwave

The Arctic is experiencing a heatwave in winter, with temperature anomalies on February 23, 2016, averaging 7.84°C or 14.11°F higher than what was common 1979-2000.


The forecast for 6:00 UTC on February 23, 2016, shows an anomaly of 8.17°C or 14.71°F.


Temperatures in January 2016 over the Arctic Ocean were 7.3°C (13.1°F) higher than in 1951-1980, according to NASA data, as illustrated by the graph on the right, from an earlier post.

These high temperatures go hand in hand with sea ice extent that is much lower for this time of year than since records started.

As discussed in an earlier post, low sea ice extent is fueling fears that this year's maximum extent was already reached on February 9, 2016.

A much higher ocean temperature is behind both the low sea ice extent and the high temperature anomalies.

Ocean temperatures are particularly high where the Gulf Stream pushes water from Atlantic Ocean into the Arctic Ocean, as illustrated by the image below that compares sea surface temperature anomalies in the Arctic between the years 2015 and 2016 for February 22nd.


This spells bad news for the sea ice in 2016, since El Niño is still going strong and ocean temperature keeps rising, as illustrated by the NOAA global ocean temperature anomalies graph for January below.

 The situation is dire and calls for comprehensive and effective action, as described in the Climate Plan.


ARCTIC WINTER HEATWAVE The Arctic is experiencing a heatwave in winter, with temperature anomalies on February 23,...
Posted by Sam Carana on Tuesday, February 23, 2016

Thursday, February 18, 2016

Has maximum sea ice extent already been reached this year?

An earlier post wondered whether maximum extent for this year had already been reached, i.e. on February 9, 2016, when sea ice extent was 14.214 million km2.

As illustrated by the image below, extent since has been lower, including on the two most recent days on the image, i.e. on February 16 and 17, 2016, when extent was respectively 14.208 and 14.203 million km2.


Last year (2015), maximum sea ice extent was reached on February 25. That's close to the most recent date on the image of February 17, so with El Nino still going strong, it may well be that the maximum in 2016 will be reached early.

On the other hand, strong winds could spread out the sea ice and speed up its drift out of the Arctic Ocean, which may result in a larger extent, but which won't do much to strengthen the sea ice.

UPDATES: On February 18, 2016 (arrow), Arctic sea ice extent was 14.186 million square km, i.e. less than it was on February 9. In fact, sea ice extent hasn't been higher on any day since February 9, 2016. So, the question is, has this year's maximum extent already passed us by (i.e. on February 9)?

The image below shows the heat is having a huge impact on the sea ice, with some areas (black) showing sea surface temperature anomalies above 8°C (or above 14.4°F).


Ominously, sea surface off the North American east coast was as much as 11.8°C or 21.3°F warmer on February 19, 2016, than it was in 1981-2011 (at the location marked by the green circle in the image below).


Temperatures over the Arctic Ocean are forecast to remain extremely high for the next five days, with anomalies in a large part of the Arctic Ocean at the top end of the scale, i.e. 20°C or 36°F.


As the image below shows, Arctic sea ice area was at a record low for the time of year on February 18, 2016.


The image below shows that Arctic sea ice extent on February 20, 2016, was only 14.166
million km2 (arrow), adding to fears that this year's maximum was already reached on February 9.


The image below shows that Arctic sea ice extent on February 21, 2016, was only 14.160
million km2 (arrow), further fueling fears that this year's maximum was already reached on February 9.


Meanwhile, very high methane levels, as high as 3096 parts per billion, were recorded on February 20, 2016, as shown by the image below.


Further analysis indicates that these high levels likely originated from destabilizing methane hydrates in sediments, from a location about latitude 85°North and longitude +105° (East), on the Gakkel Ridge, just outside the East Siberian Arctic Shelf, at the location of the red marker on the map below.

Below is a comparison map, from grida.no
for large-size image, go to grida.no
Below is a map with sea surface temperature anomalies on February 20, 2016. The green circle marks the likely location of sediment destabilization and subsequent methane plume, at about latitude 85°North and longitude +105° (East), on the Gakkel Ridge, just outside the East Siberian Arctic Shelf.

zoom in and out at nullschool.net
If you like, you can discuss this further at the Arctic News group or below.


On February 18, 2016 (arrow), Arctic sea ice extent was 14.186 million square km, i.e. less than it was on February 9....
Posted by Sam Carana on Friday, February 19, 2016

Monday, February 15, 2016

Arctic sea ice remains at a record low for time of year

For the time of year, Arctic sea ice remains at a record low since satellite records started in 1979, both for area and extent. The image below shows Arctic sea ice area up to February 12, 2016, when area was 12.49061 million square km.


The image below shows Arctic sea ice extent up to February 12, 2016, when extent was 14.186 million square km.


The reason for the record low sea ice is that there is more ocean heat than there used to be. The image below shows that on February 12, 2016, the Arctic Ocean sea surface temperature was as warm as 11.3°C (52.4°F) at a location near Svalbard marked by the green circle, a 10.4°C (18.7°F) anomaly.


The reason for this is that the water off the east coast of North America is much warmer than it used to be.

The Gulf Stream is pushing heat all the way into the Arctic Ocean.

The image below shows that on February 14, 2016, sea surface temperature anomalies (compared to 1981-2011) off the east coast of North America were was as high as 10.1°C or 18.1°F (at the location marked by the green circle).

While sea surface looks cooler (compared to 1981-2011) over a large part of the North Atlantic, an increasing amount of ocean heat appears to be traveling underneath the sea surface all the way into the Arctic Ocean, as discussed at this earlier post.

This spells bad news for the sea ice in 2016, since El Niño is still going strong. Temperatures in January 2016 over the Arctic Ocean were 7.3°C (13.1°F) higher than in 1951-1980, according to NASA data, as illustrated by the graph on the right.

See the Controversy page for discussion
A polynomial trend added to the January land temperature anomaly on the Northern Hemisphere since 1880 shows that a 10°C (18°F) rise could eventuate by the year 2044, as illustrated by the graph on the right. Over the Arctic Ocean, the rise can be expected to be even more dramatic.

As the NASA map below illustrates, the global January 2016 land-ocean temperature anomaly from 1951-1980 was 1.13°C (or over 2°F) and the heat did hit the Arctic Ocean stronger than elsewhere.

In January 2016, it was 1.92°C (3.46°F) warmer on land than in January 1890-1910. Before 1900, temperature had already risen by ~0.3°C (0.54°F), which makes it a joint 2.22°C (4°F) rise. On the Northern Hemisphere, the rise on land was the most profound, with over 10°C (18°F) warming occurring at the highest latitudes.


Meanwhile, methane levels as high as 2539 parts per billion (ppb) were recorded on February 13, 2016, as illustrated by the image below.


The danger is that, as the Arctic Ocean keeps warming, huge amounts of methane will erupt abruptly from its seafloor.

The situation is dire and calls for comprehensive and effective action as described at the Climate Plan.

Update: Arctic sea ice extent keeps falling. Last year (2015), maximum sea ice extent was reached on February 25. Could it be that maximum extent for this year was already reached on February 9, 2016? The image below illustrates this question. discussed further at the Arctic News group.

discuss this further at the Arctic News group


Arctic sea ice extent keeps falling. Last year (2015), maximum sea ice extent was reached on February 25. Could it be...
Posted by Sam Carana on Monday, February 15, 2016

Thursday, February 11, 2016

Methane's Role in Arctic Warming

Arctic Ocean hit most strongly by global warming


Over the past 12 months, global warming was felt most strongly over the Arctic Ocean, as above image illustrates. Over most parts of the Arctic Ocean, surface temperatures were above the top end of the scale, i.e. more than 2.5°C higher than in 1981-2010.

In January 2016, air temperatures close to sea level (at 925 hPa) were more than 6°C or 13°F above average across most of the Arctic Ocean, as NSIDC.org announced recenty. Moreover, daily average temperatures over many parts of the Arctic Ocean often exceed the top end of the scale, i.e. 20°C or 36°F higher than in 1979-2000, as illustrated by the Climate Reanalyzer forecast below.


So, how can temperature anomalies over the Arctic Ocean at this time of year be so much higher than elsewhere on Earth?

One factor is feedbacks such as changes to the jet stream and decline of snow and ice cover in the Arctic that makes that ever more sunlight is getting absorbed by the water of the Arctic Ocean, in turn causing further decline, as discussed in many earlier posts.

Right now, however, warming over the Arctic Ocean is very pronounced at a time of year when there is a wider temperature difference between the Arctic and the Equator, while there is little or no sunlight reaching the Arctic. So, albedo changes are less relevant, while changes to the jet stream would be expected to be less prominent now. Nonetheless, a strongly deformed jet stream can push a lot of warm air all the way up to the North Pole, while pushing a lot of cold air out of the Arctic over North America, as illustrated by the forecast on the right.

Let's look at some further factors that are at work.

High levels of greenhouse gases over the Arctic


The question was, why is warming hitting to Arctic Ocean so strongly at this time of year? Greenhouse gas levels are higher over the Arctic than elsewhere on Earth. Greenhouse gases trap heat that would otherwise be radiated out to space, and this greenhouse effect is occurring all year long.

[ click on images to enlarge them ]
Let's look more closely at carbon dioxide (CO2) levels. On February 4, 2016, CO2 level at Mauna Loa, Hawaii, was 405.83 ppm, as illustrated by the image on the right

The image below shows that global mean CO2 level on February 6, 2016, was 407 ppm at an altitude close to sea level (972 mb). The image also shows higher CO2 levels at higher latitudes north, with levels over 410 ppm showing up over most of the Northern Hemisphere. 


Carbon dioxide levels on Feb. 8, 2016, were as high as 416 ppm at a location over the Kara Sea (marked by the green circle at the top of the image on the right).

Nonetheless, the levels of carbon dioxide over the Arctic Ocean are not that much higher than elsewhere, i.e. not enough to explain such huge temperature anomalies.

Methane, another greenhouse gas, is also present over the Arctic Ocean at levels that are higher than the rest of the world, as illustrated by the image below, showing methane levels over 1900 ppb over most of the Arctic Ocean on February 4, 2016. 


In the case of methane, the situation is different than for carbon dioxide:
  • levels at the North Pole are more than 10% higher than at the South Poles, a much larger difference than for carbon dioxide. 
  • methane is reaching its highest levels over the Arctic Ocean from October onward to well into the next year. 
  • methane persists longer over the Arctic due to low hydroxyl levels there. 
  • methane levels over the Arctic Ocean are high, as increasingly large amounts of methane are rising up from the Arctic Ocean seafloor, making that this methane will inherently be highly concentrated over the Arctic, especially shortly after its release. 

In conclusion, it looks like methane is playing an increasingly large role in warming up the Arctic, especially given its large short-term potency as a greenhouse gas.

from: arctic-news.blogspot.com/p/methane.html

AMOC is carrying ever more heat into the Arctic Ocean

Besides methane, there is another big reason why temperature anomalies are so high over Arctic Ocean at this time of year. Huge amounts of heat are rising up from the water into the atmosphere over the Arctic Ocean, warming up the air over the water. The warmer the sea, the less ice will form. The weaker the ice, the more cracks and spots where heat gets transferred to the atmosphere.

The water of the Arctic Ocean is getting warmer, compared to previous years, as the Gulf Stream heats up. When referring to the full length from the Gulf of Mexico to the Arctic Ocean, this current is often referred to as the North Atlantic Meridional Overturning Circulation (AMOC). The direction of AMOC's flow is determined by two forces, i.e. the flow of warm water from the Equator to the north, and the the flow east due to the Coriolis force. The result is warm, salty water is carried by AMOC in the upper layers of the Atlantic toward the north-east, to Arctic Ocean. Eventually, the water sinks and flows back as colder water through the deep Atlantic. As the NOAA image below shows, the amount of heat that has been carried by AMOC toward the Arctic Ocean has been increasing over the past few years.


Overall ocean temperatures are increasing, as discussed in posts such as Ocean Heat and Temperature Rise. As a result, more heat is getting carried toward the Arctic Ocean now. The Gulf Stream off the coast of North America is warming up strongly and is pushing more heat toward the Arctic ocean, compared to previous years. The result is illustrated by the image below, showing huge sea surface temperature anomalies in the Arctic Ocean near Svalbard, despite the cold lid on the north Atlantic, indicating that the heat is continuing to travel underneath the cold freshwater lid to the Arctic Ocean.


Such high sea surface temperature anomalies are not uncommon in the Arctic Ocean these days. The image below shows that on January 24, 2016, sea surface temperature was 12.3°C or 54.2°F at a location near Svalbard marked by the green circle, a 10.4°C or 18.7°F anomaly.

from: Arctic sea ice area at record low for time of year
Water now much warmer off the North American coast

The water off the east coast of North America is much warmer than it used to be due to emissions that extend from North America over the Atlantic Ocean due to the Coriolis force. The image below, from an earlier post, shows carbon dioxide levels as high as 511 ppm over New York on November 5, 2015, and as high as 500 ppm over the water off the coast of coast of New Jersey on November 2, 2015.

from the post: 2015 warmest year on record
The image below shows carbon monoxide levels. Carbon monoxide depletes hydroxyl, making it harder for methane to be oxidized. So again methane appears to be a major factor.

from: Arctic sea ice area at record low for time of year
Such emissions heat up the Gulf Stream and make that ever warmer water is carried underneath the sea surface all the way into the Arctic Ocean. 

Cold freshwater lid on the North Atlantic

Finally, the cold freshwater lid on the North Atlantic makes that less heat transfer occurs from ocean to atmosphere. This cold freshwater lid makes that more heat is flowing toward the Arctic Ocean just below the sea surface of the North Atlantic. 

sea ice speed and drift, forecast for February 18, 2016
This cold freshwater lid is spreading over the North Atlantic for a number of reasons: 
  • more melting of glaciers on Greenland, on Svalbard and in North Canada; 
  • more sea ice drifting into the Atlantic Ocean due to stronger winds. Storms move up the Atlantic in a circular way, speeding up sea ice drift along the edges of Greenland, as illustrated by this video and the images on the right;
  • stronger evaporation off the east coast of North America, with moisture being carried by stronger winds to the north-east, resulting in more precipitation settling on the water and thus freshwater getting added to the North Atlantic, as illustrated by the image below.


As above image also illustrates, this cold freshwater lid on the North Atlantic could also result in more heat being carried into the Arctic Ocean, due to reduced heat transfer to the atmosphere from water on its way to the Arctic Ocean.


Above image illustrates how higher temperatures over the Arctic (top panel) can go hand in hand with the cold freshwater lid over the North Atlantic (second panel), with high sea surface temperatures off the east coast of North America (third panel) and with higher precipitation over this cold freshwater lid (bottom panel).

The image below indicates that the cold freshwater lid on the North Atlantic also goes hand in hand with falling salinity levels.


Precipitation over the North Atlantic is increasing, due to stronger winds and storms there, as discussed in earlier posts such as this one and as illustrated by the images below. Stronger winds, storms with high levels of precipitation and higher waves can all make the cold freshwater lid spread further across the North Atlantic. 


Above image show that waves as high as 17.81 m or 58.4 ft were forecast for the North Atlantic on February 1, 2016, and as high as 17.31 m or 56.8 ft for February 8, 2016.


Conclusion

In conclusion, the danger is that ever more heat will arrive in the Arctic Ocean. This will result in greater melting of the sea ice, in a self-reinforcing feedback loop that makes that more sunlight gets absorbed by the Arctic Ocean (rather than being reflected back into space, as before).

On February 11, 2016, Arctic sea ice had - for this time of year - the lowest extent since satellite records started in 1979, as illustrated by the image below.

The biggest danger is that, as the Arctic Ocean continues to warm, huge amounts of methane will erupt abruptly from the seafloor of the Arctic Ocean, driving up temperatures over the Arctic dramatically and triggering ever more methane eruptions, resulting in a rapid escalation into runaway warming.

The situation is dire and calls for comprehensive and effective action, as described in the Climate Plan.