High levels of biomass-burning aerosols show up over North America on the above June 7, 2023 06 UTC forecast by Copernicus.
The above satellite image shows the US East Coast, with New York blanketed in a veil of smoke on June 7, 2023.
High levels of carbon monoxide are visible over North America on the above map. Carbon monoxide is forecast to be as high as 8715 parts per billion in Quebec, Canada on June 8, 2023 (at 12:00 UTC, a few hours from now, at the green circle).
The map below shows the location for this measurement in Quebec, Canada on June 8, 2023 (at red marker).
The image below also shows wind at 250 hPa, i.e. the Jet Stream. The circular wind patterns indicate how deformed the Jet Stream is.
The image below, from an earlier post, further illustrates the extent of the deformation of the Jet Stream, showing the Jet Stream on June 6, 2023, with no less than 26 circular wind patterns (at 250 hPa) marked on the image, which also shows sea surface temperature anomalies. The Jet Stream is also crossing the Equator.
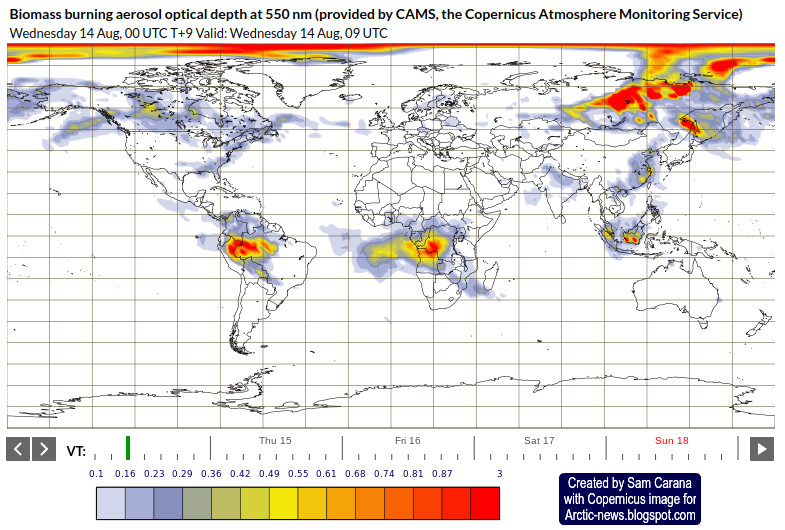
As an update, below is a forecast of biomass-burning aerosols for June 14, 2023.
Record low Arctic sea ice extent for the time of year
Arctic sea ice minimum extent typically occurs about half September. In 2012, minimum extent was reached on September 17, 2012, when extent was 3.387 million km².
On July 28, 2019, Arctic sea ice extent was 6.576 million km². How much extent do you think there will be by September 17, 2019? From July 28, 2019, to September 17, 2019, that's a period of 52 days during which a lot of melting can occur. Could there be a Blue Ocean Event in 2019, with virtually all sea ice disappearing in the Arctic?
Consider this. Extent was 6.926 million km² on September 17, 1989. Extent was 3.387 million km² on September 17, 2012, so 3.539 million km² had disappeared in 23 years. Over those years, more ice extent disappeared than what was left on September 17, 2012.
The question is how much sea ice extent will be left when it will reach its minimum this year, i.e. in September 2019. The red dashed line on the image at the top continues the path of the recent fall in sea ice extent, pointing at zero Arctic sea ice extent in September 2019. Progress is followed at this post.
Zero Arctic sea ice in 2019
Zero Arctic sea ice in 2019 sounds alarming, and there is good reason to be alarmed.
Above map shows temperatures on Greenland on July 31, 2019, with temperatures at one location as high as 23.2°C or 73.8°F and at another location - in the north - as high as 14.2°C or 57.6°F.
The map on the right shows sea surface temperature anomalies compared to 1961-1990 as on July 29, 2019. Note the high anomalies in the areas where the sea ice did disappear during the past few months. The reason for these high anomalies is that the buffer has disappeared that previously had kept consuming heat in the process of melting.
Where that buffer is gone, the heat has to go somewhere else, so it will be absorbed by the water and it will also speed up heating of the atmosphere over the Arctic.
Sea ice melting is accelerating for a number of reasons:
Ocean Heat - Much of the melting of the sea ice occurs from below and is caused by heat arriving in the Arctic Ocean from the Atlantic Ocean and the Pacific Ocean.
Direct Sunlight - Hot air will melt the ice from above and this kind of melting can increase strongly due to changing wind patterns.
Rivers - Heatwaves over land can extend over the Arctic Ocean and they also heat up river water flowing into the Arctic Ocean.
Fires - Changing wind patterns can also increase the intensity and duration of such heatwaves that can also come with fires resulting in huge amounts of greenhouse gas emissions, thus further speeding up the temperature rise, and also resulting in huge emissions of soot that, when settling on sea ice, speeds up melting (see images below).
Numerous feedbacks will further speed up melting. Heating is changing the texture of the sea ice at the top and is making melt pools appear, both of which cause darkening of the surface. Some further feedbacks, i.e. storms and clouds are discussed below in more detail.
Above combination image shows smoke from fires in Siberia getting pushed over the Laptev Sea on August 11, 2019, due to cyclonic winds over the Arctic Ocean. This was also discussed in an earlier post. The image below shows the situation on August 12, 2019.
The image below shows the situation on August 14, 2019.
In the video below, Paul Beckwith discusses the heating impact of albedo loss due to Arctic sea ice loss, including the calculations in a recent paper.
As the Arctic is heating up faster than the rest of the world, it is also more strongly affected by the resulting extreme weather events, such as heatwaves, fires, strong winds, rain and hail storms, and such events can strongly speed up the melting of the sea ice.
All around Greenland, sea ice has now virtually disappeared. This is the more alarming considering that the thickest sea ice was once located north of Greenland. This indicates that the buffer is almost gone.
Why is disappearance of Arctic sea ice so important? Hand in hand with albedo loss as the sea ice disappears, there is loss of the buffer (feedbacks #1, #14 and more). As long as there is sea ice in the water, this sea ice will keep absorbing heat as it melts, so the temperature will not rise at the sea surface. The amount of energy absorbed by melting ice is as much as it takes to heat an equivalent mass of water from zero to 80°C.
Once the sea ice is gone, further heat must go elsewhere. This heat will raise the temperature of the water and will also make the atmosphere heat up faster.
Storms and Clouds
Storms: As temperatures in the Arctic are rising faster than at the Equator, the Jet Stream is changing, making it easier for warm air to enter the Arctic and for cold air to descend over continents that can thus become much colder than the oceans, and this stronger temperature difference fuels storms.
Clouds: More evaporation will occur as the sea ice disappears, thus further heating up the atmosphere (technically know as latent heat of vaporization).
In the video below, Paul Beckwith further discusses Arctic albedo change and clouds.
Disappearance of the sea ice causes more clouds to form over the Arctic. This on the one hand makes that more sunlight gets reflected back into space. On the other hand, this also make that less outward infrared radiation can escape into space. The net effect of more clouds is that they are likely cause further heating of the air over the Arctic Ocean (feedbacks #23 and #25).
More low-altitude clouds will reflect more sunlight back into space, and this occurs most during Summer when there is most sunshine over the Arctic. The image below, a forecast for August 17, 2019, shows rain over the Arctic. Indeed, more clouds in Summer can also mean rain, which can devastate sea ice, as discussed in an earlier post.
Regarding less outward radiation, the IPCC has long warned, e.g. in TAR, about a reduction in outgoing longwave radiation (OLR): "An increase in water vapour reduces the OLR only if it occurs at an altitude where the temperature is lower than the ground temperature, and the impact grows sharply as the temperature difference increases."
While reduction in OLR due to water vapor is occurring all year long, the impact is particularly felt in the Arctic in Winter when the air is much colder than the surface. In other words, less OLR makes Arctic sea ice thinner, especially in Winter.
The inflow of ocean heat into the Arctic Ocean can increase strongly as winds increase in intensity. Storms can push huge amounts of hot, salty water into the Arctic Ocean, as discussed earlier, such as in this post and this post. As also described at the extreme weather page, stronger storms in Winter will push more ocean heat from the Atlantic toward the Arctic Ocean, further contributing to Arctic sea ice thinning in Winter.
Seafloor Methane
As the buffer disappears that until now has consumed huge amounts of heat, the temperature of the water of the Arctic Ocean will rise even more rapidly, with the danger that further heat will reach methane hydrates at the seafloor of the Arctic Ocean, causing them to get destabilized and release huge amounts of methane (feedback #16).
Ominously, high methane levels were recorded at Barrow, Alaska, at the end of July 2019, as above image shows.
And ominously, a mean global methane level as high as 1902 ppb was recorded by the MetOp-1 satellite in the afternoon of July 31, 2019, as above image shows.
As the image on the right shows, mean global levels of methane (CH₄) have risen much faster than carbon dioxide (CO₂) and nitrous oxide (N₂O), in 2017 reaching, respectively, 257%, 146% and 122% their 1750 levels.
Temperature Rise
Huge releases of seafloor methane alone could make marine stratus clouds disappear, as described in an earlier post, and this clouds feedback could cause a further 8°C global temperature rise.
Indeed, a rapid temperature rise of as much as 18°C could result by the year 2026 due to a combination of elements, including albedo changes, loss of sulfate cooling, and methane released from destabilizing hydrates contained in sediments at the seafloor of oceans.
• Contribution of sea ice albedo and insulation effects to Arctic amplification in the EC-Earth Pliocene simulation, by Jianqiu Zheng et al. (2019) https://www.clim-past.net/15/291/2019
As an earlier Arctic-news analysis shows, Earth may have long crossed the 1.5°C guardrail set at the Paris Agreement.
Earth may have already been in the Danger Zone since early 2014. This is shown by the image on the right associated with the analysis, which is based on NASA data that are adjusted to reflect a preindustrial baseline, air temperatures and Arctic temperatures.
As the added 3rd-order polynomial trend shows, the world may also be crossing the higher 2°C guardrail later this year, while temperatures threaten to keep rising dramatically beyond that point.
What is the threat?
As described at the Threat, much carbon is stored in large and vulnerable pools that have until now been kept stable by low temperatures. The threat is that rapid temperature rise will hit vulnerable carbon pools hard, making them release huge amounts of greenhouse gases, further contributing to the acceleration of the temperature rise.
Further release of greenhouse gases will obviously further speed up warming. In addition, there are further warming elements that could result in very rapid acceleration of the temperature rise, as discussed at the Extinction page.
The Danger Zone
Below are some images illustrating just how dire the situation is, illustrating how vulnerable carbon pools are getting hit exactly as feared they would be with a further rise in temperature.
On July 5, 2018, it was as hot as 33.5°C or 92.3°F on the coast of the Arctic Ocean in Siberia (at top green circle, at 72.50°N). Further inland, it was as hot as 34.2°C or 93.5°F (at bottom green circle, at 68.6°N).
The satellite image below shows smoke from fires over parts of Siberia hit strongly by heat waves.
The fires caused carbon monoxide levels as high as 20,309 ppb over Siberia on July 3, 2018.
Methane levels that day were as high as 2,809 ppb.
On July 4, 2018, forest fires near the Lena River cause smoke over the Laptev Sea and East Siberian Sea. CO (see inset) and CO₂ levels that day were as high as 45080 ppb and 724 ppm (at the green circle), as illustrated by the image below.
The Copernicus image below shows aerosol forecasts for July 4, 2018, 21:00 UTC, due to biomass burning.
Another Copernicus forecast shows high ozone levels over Siberia and the East Siberian Sea.
EPA 8-hour ozone standard is 70 ppb and here's a report on recent U.S. ozone levels. See Wikipedia for more on the strong local and immediate warming impact of ozone and how it also makes vegetation more vulnerable to fires.
The global 10-day forecast (GFS) below, run on July 3, 2018, with maximum 2 meter temperature, shows that things may get even worse over the coming week or more.
Could we move out of the Danger Zone?
What can be done to improve this dire situation?
One obvious line of action is to make more effort to reduce emissions that are causing warming. There's no doubt that this can be achieved and has numerous benefits, as described in an earlier post. Emission cuts can be achieved by implementing effective policies to facilitate changes in energy use, in diet and in land use and construction practices, etc.
One complication is that the necessary transition away from fossil fuel is unlikely to result in immediate falls in temperatures. This is the case because there will be less sulfur in the atmosphere to reflect sunlight back into space. Furthermore, there could also be an increase in biomass burning, as discussed at the Aerosols page, while the full wrath of recent carbon dioxide emissions is yet to come. As said, the resulting rise in temperature threatens to trigger numerous feedbacks that could accelerate the temperature rise even further. For more on how much temperatures could rise, see the Extinction page.
While it's clear that - besides emission cuts - further action is necessary, such as removing greenhouse gases from the atmosphere and oceans, the prospect is that such removal will have to continue for decades and decades to come before it can bring greenhouse gases down to safer levels. To further combat warming, there are additional lines of action to be looked at, but as long as politicians remain reluctant to even consider pursuing efforts to reduce emissions, we can expect that the world will be in the Danger Zone for a long time to come.
The situation is dire and calls for comprehensive and effective action, as described in the Climate Plan.
Levels of carbon dioxide (CO2) in the atmosphere are accelerating, even though emissions from fossil fuel burning have remained virtually the same over the past few years.
One of the reason behind this is accelerating emissions from wildfires as temperatures are rising.
Wildfires in Nevada caused CO2 to reach levels as high as 742 ppm on July 12, 2017 (green circle image on the right).
Global warming is greatly increasing the chance for what was previously seen as an extreme weather event to occur, such as a combination of droughts and storms. Heat waves and droughts can cause much vegetation to be in a bad condition, while high temperatures can come with strong winds, storms and lightning.
Wildfires cause a range of emissions, including CO2, soot, methane and carbon monoxide (CO). In Nevada, CO levels were as high as 30.43 ppm (green circle image right).
Above satellite image below shows the smoke plumes and the charred area. The google maps image below further shows where the fires were burning.
At the moment, wildfires are hitting many places around the world.
Wildfires caused carbon dioxide to reach levels as high as 746 ppm in Kazakhstan on July 11, 2017 (green circle on image on the right).
The satellite image shows wildfires in Kazakhstan on July 9, 2017.
The satellite images show wildfires in Kazakhstan on July 11, 2017.
On July 16, 2017, CO₂ reached levels as high as 830 ppm in North America at the location marked by the green circle on the image below. Note that fires are burning at multiple locations.
The image below shows the location (red marker) where the fires burned in Canada.
That same day, July 16, 2017, CO₂ reached levels as high as 873 ppm in Mongolia, as shown by the image on the right.
The image also shows further fires burning in Siberia.
Carbon monoxide levels were as high as 37.19 ppm where the fires burned in Mongolia on July 16, 2017, as shown by the image below.
The image below shows the location (red marker) where the fires burned in Mongolia. The image also shows Lake Baikal across the border with Russia.
On July 22, 2017, CO₂ reached levels as high as 1229 ppm in Montana, while CO levels at the time were as high as 56.38 ppm at that location (green circle on image below).
The satellite image below shows the situation in Montana on the next day, July 23, 2017. See also the
NASA post Grassland Fires Tear Through Montana.
Furthermore, on July 23, 2017, CO₂ reached levels as high as 884 ppm at another (nearby) location in Montana (green circle on image below).
Meanwhile, temperatures keep rising. Surface temperature as high as 53.1°C or 127.5°F were forecast in Iran for July 11, 2017, at the location marked by the green circle on the image below.
At 1000 mb (image below), temperatures in Iran were forecast to be slightly lower, i.e. as high as 51.9°C or 125.3°F at the location marked by the at green circle, but note the difference in color, especially over Greenland, the Himalayas and the Tibetan Plateau.
The situation is dire and calls for comprehensive and effective action as described at the Climate Plan.
Aerosols
Some aerosols, particularly sulfur dioxide, have a cooling effect, making that they partly mask the warming effect of other emissions by people. The IPCC AR4 image below shows that the direct and cloud albedo effect of aerosols equals a radiative forcing of as much as -2.7 W/m². In other words, if this masking effect were to fall away, warming would increase by as much as 2.7 W/m², according to IPCC AR4 figures.
Anthropogenic aerosols are also suppressing the Pacific Decadal Oscillation, making that less heat gets transferred from oceans to the atmosphere. Recent research concludes that future reduction of anthropogenic aerosol emissions, particularly from China, would promote positive Pacific Decadal Oscillation, thus further speeding up warming over the coming years.
Dimethyl sulphide emissions from oceans constitute the largest natural source of atmospheric sulphur, and such emissions can decrease with ongoing ocean acidification and climate change. This could particularly impact specific regions such as Antarctica, speeding up warming and loss of sea ice there, as discussed at this paper.
The net warming effect of open biomass burning was estimated in a 2014 study by Mark Jacobson to amount to 0.4 W/m² of radiative forcing. Imagine a scenario in which many people stopped burning fossil fuels for heating, cooking and energy. That would be great, but if many of them instead switched to burning biomass in woodburners and open fires, while wildfires increased strongly, the net warming from associated aerosols would increase dramatically.
A recent paper by James Hansen uses equilibrium fast-feedback climate sensitivity of ¾°C per W/m², while another recent paper suggest that the temperature rise per W/m² could be even stronger.
A high-end increase in net radiative forcing combined with a strong temperature rise per W/m² could cause a temperature rise as a result of changes in aerosols of as much as 2.5°C in a matter of years, as suggested in earlier posts such as this one.
• Amplification of global warming through pH-dependence of DMS-production simulated with a fully coupled Earth system model, by Jörg Schwinger et al. https://www.biogeosciences-discuss.net/bg-2017-33