Showing posts with label seabed. Show all posts

Friday, October 30, 2015

Methane Vent Hole In Arctic Sea Ice?

Methane vent hole in the ice?

In October 2015, an area appeared in the Arctic sea ice where the temperature of the ice was a few degrees Celsius higher and where ice concentration and salinity levels were substantially lower than the surrounding ice. The image below pictures the situation on October 11, 2015.

[ click on image to enlarge ]
Could this have been an iceberg? If so, ice concentration should have been higher, rather than lower. More likely is that this is a vent hole with methane rising through cracks in the sea ice.

Malcolm Light comments: "The whole of the Arctic seabed is covered with methane hydrates and NASA satellites should have long ago defined where the major plumes were coming out. It is clearly a surface methane vent hole in the ocean ice analogous to the large methane vent holes that appeared all over northern Siberia this year. It means we have overheated the Arctic seafloor to the extent where the methane hydrates are now unstable and we could have further major releases at any time. We have already lit the fuse on a giant methane subsea permafrost bomb in the Arctic which can go off at any moment."

Roger Caldwell responds: "I think it's upwelling warm water. There is a ridge right below the spot. I can see warm spots through the ice on the nullschool program. The warm water comes through the Bering Strait and sinks to the mid levels. When it gets to the ridge it flows upward, making a temporary polynya."

The image below shows warm water entering the Arctic Ocean from the Pacific Ocean (through the Bering Strait) and the Atlantic Ocean, with the dark-red color of many areas in the Arctic Ocean indicating warm waters, including an area close to the North Pole marked by the red circle. So, the spot could indeed be a polynya caused by upwelling of warm water. Alternatively to the Pacific Ocean, the warm water could have originated from the Atlantic Ocean. In the Fram Strait, near Svalbard, sea surface temperatures as high as 11.9°C or 53.5°F were recorded on October 28, 2015, i.e. 9.6°C or 17.2°F warmer than 1981-2011 (at the location marked by the green circle).

[ click on image to enlarge ]
Of course, with water this warm reaching the center of the Arctic Ocean, the threat that this will cause (further) destabilization of methane hydrates at the seafloor of the Arctic Ocean is equally ominous. The more recent image below shows warm waters in the Arctic Ocean in a different way, partly because the anomaly is calculated from the period 1961 to 1990.


The image below shows that sea surface temperatures as high as 12°C or 53.5°F were recorded near Svalbard on October 31, 2015, i.e. 9.7°C or 17.4°F warmer than 1981-2011 (at the location marked by the green circle).

[ click on image to enlarge ]
On the image below, Malcolm Light added the Gakkel Ridge, i.e. the fault line that extends on the seafloor of the Arctic Ocean from the northern tip of Greenland to Siberia (red line), and the location of explosive volcanoes (lilac spot), with content from Sohn et al., 2008.

A zone of increased heat near the North Pole which may be related to large quantities of gas released from a group of extremely pyroclastic carbon dioxide-rich volcanoes located at the Gakkel Ridge 
The table below shows the height that emerging carbon dioxide plumes can be expected to reach for a given carbon dioxide volume fraction in the foam at the top of a magma chamber.

Malcolm Light adds:
"Sohn et al. (2007) outlined how the sequence of extreme pyroclastic eruptions occur along the Gakkel Ridge (85°E volcanoes) at an ultra-slow plate spreading rate (<15-20 mm/year). These volcanoes formed from the explosive eruption of gas-rich magmatic foams. Long intervals between eruptions with slow spreading caused huge gas (volatile) build up high storage pressures, deep in the crust. 

Extension of the 85°E seismic swarm occurred over 3 months but later earthquakes were caused by large implosions from the explosive discharge of pressurized magmatic foam from a deep-lying magma chamber through the fractured chamber roof which rapidly accelerated vertically, expanded and decompressed. There were many periods of widespread explosive gas discharge from 1999 over two years detected by small-magnitude sound signals from seismic networks on the ice. 

Pyroclastic rocks contain bubble wall fragments and were widely distributed over an area of more than 10 square km. Deep fragmentation was caused by the accumulation of a gas (volatile) foam within the magma chamber which then fractured, formed a pyroclastic fountain 1-2 km high in the Arctic Ocean and spread the pyroclastic material over a region whose size was proportional to the depth of the magma chamber (see above table). A volatile carbon dioxide content of 14% (Wt./Wt. - volume fraction 75%) is necessary at 4 km depth in the Arctic Ocean to fragment the erupting magma." 

As said, with water this warm reaching the center of the Arctic Ocean from the Atlantic and Pacific Oceans, the threat is that added heat from volcanic activity or pressure shocks from underwater earthquakes or landslides will trigger (further) destabilization of methane hydrates at the seafloor of the Arctic Ocean.

Below follows some more background.

Animations

Naval Research Laboratory 30-day animations are added below for temperature, concentration, salinity and thickness of the sea ice. Click on each of them to view full versions.

Temperature
Concentration

Salinity

Thickness

[ click on animations to enlarge ]

Background on tectonic plates and faults

A major fault line crosses the Arctic Ocean, forming the boundary between two tectonic plates, the North American Plate and the Eurasian Plate. These plates slowly diverge, creating seismic tension along the fault line. From where the Mid-Atlantic ridge enters the Arctic Ocean, it is called the Gakkel Ridge. The fault continues as the Laptev Sea Rift, on to a transitional deformation zone in the Chersky Range in Siberia, then the Ulakhan Fault between the North American Plate and the Okhotsk Plate, and then continues as the Aleutian Trench to the end of the Queen Charlotte Fault system.


The situation in October 2013

High methane readings were recorded for a period of just over one day, October 19 - 20, 2013, as shown in the images below. Indicated in yellow are all methane readings of 1950 ppb and over.


To pointpoint more closely where methane is venting along the Laptev Sea Rift, the image below gives readings for October 20, 2013, pm, at just three altitudes (607 - 650 mb).


Satellite measurements recorded methane readings of up to 2411 ppb on October 20, 2013.

Methane venting in the Laptev Sea in 2005 and 2007

For further reference, large amounts of methane have been venting in the Laptev Sea area in previous years. Added below is an edited part of a previous post, Unfolding Climate Catastrophe.

In September 2005, extremely high concentrations of methane (over 8000 ppb, see image on the right) were measured in the atmospheric layer above the sea surface of the East Siberian Shelf, along with anomalously high concentrations of dissolved methane in the water column (up to 560 nM, or 12000% of super saturation).

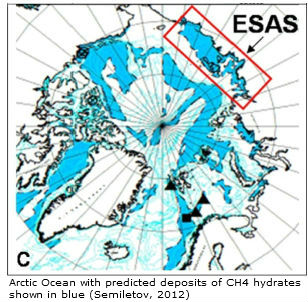
The authors conclude: "Since the area of geological disjunctives (fault zones, tectonically and seismically active areas) within the Siberian Arctic shelf composes not less than 1-2% of the total area and area of open taliks (area of melt through permafrost), acting as a pathway for methane escape within the Siberian Arctic shelf reaches up to 5-10% of the total area, we consider release of up to 50 Gt of predicted amount of hydrate storage as highly possible for abrupt release at any time".

In 2007, concentrations of dissolved methane in the water column reached a level of over 5141 nM at a location in the Laptev Sea. For more background, see the previous post, Unfolding Climate Catastrophe.

Methane levels in October 2015

The image below shows high methane concentrations over the Arctic Ocean on October 11, 2015, pm, at 840 mb, i.e. relatively close to sea level.


The image below shows high levels of methane over the Arctic Ocean at higher altitude (469 mb) on October 28, 2015, pm, when methane levels were as high as 2345 ppb. 


Note that the above two images have different scales. The data are from different satellites. The video below shows images from the MetOp-2 satellite, October 31, 2015, p.m., at altitudes from 3,483 to 34,759 ft or about 1 to 11 km (241 - 892 mb).


Peak methane levels were as high as 2450 ppb on November 1, 2015.

Update: Warm Water in Arctic Ocean

On November 5, 2015, sea surface temperatures as high as 8.5°C or 47.3°F showed up in the Bering Strait, an anomaly of 6.6°C or 11.9°F, while sea surface temperatures as high as 14.4°C or 57.9°F showed up near Svalbard on November 5, 2015, a 12.2°C or 22°F anomaly. The situation is illustrated by the image below.

[ click on image to enlarge ]
These high temperatures indicate that the sea can be a lot warmer below the surface than at the surface, and it appears that very warm waters are continuing to enter the Arctic Ocean from both the Pacific Ocean and the Atlantic Ocean. As discussed in previous posts such as this one, the danger is that ever warmer waters will (further) destabilize methane hydrates at the seafloor of the Arctic Ocean, resulting in abrupt methane eruptions that could dwarf the impact of existing greenhouse gases in the atmosphere.

Climate Plan

The situation is dire and calls for comprehensive and effective action, as discussed at the Climate Plan.


Links

- Explosive volcanism on the ultraslow-spreading Gakkel ridge, Arctic Ocean, Sohn et al. (2007, published 2008)
http://www.nature.com/nature/journal/v453/n7199/full/nature07075.html

- Unfolding Methane Catastrophe
http://arctic-news.blogspot.com/2013/10/unfolding-methane-catastrophe.html

- Further Confirmation of a Probable Arctic Sea Ice Loss by Late 2015, by Malcolm P.R. Light (Sep. 1, 2012)
http://arctic-news.blogspot.com/2012/09/further-confirmation-of-a-probable-arctic-sea-ice-loss-by-late-2015-loss.html

In October 2015, an area appeared in the Arctic sea ice where the temperature of the ice was a few degrees Celsius...
Posted by Sam Carana on Friday, October 30, 2015

Sunday, October 6, 2013

Just do NOT tell them the monster exists

The Arctic Methane Monster

As discussed in a previous post, the IPCC appears to be acting as if there was a carbon budget to divide among countries, whereas in reality there is a huge carbon debt to our children, while the situation could become catastrophic any time soon.

Indeed, carbon dioxide is not the only greenhouse gas and the Arctic methane monster is threatening to disrupt the cosy lifetyle of those who want to keep selling parts of such non-existing carbon budgets.

So, who do you think the IPCC has been listening to, to reach a conclusion after six years of analysis? Experts or snake oil sellers? The cartoon may give you a hint, but why don't you make up your own mind by going over the IPCC statements and comments below.

Abrupt Climate Change

The IPCC recently issued AR5 documents that included a discussion of Abrupt Climate Change.

from: IPCC AR5 Working Group 1 Technical Summary (final draft)
The IPCC gives some examples:


Yes, methane release from clathrates sounds scary.


If there is little consensus on the likelihood, then surely some experts do believe it is likely. Yet, the IPCC somehow reaches the following conclusion, and does so with high confidence:


Unlikely? What was the basis for this IPCC conclusion? 

This seems like a conclusion that can only have been reached after a robust analysis of all the evidence. So, how did the IPCC reach this conclusion, given that it did so with such high confidence?

Let's have a look. The above conclusion is preceeded by this statement:


OK, that means clathrates will increasingly become destabilized. The IPCC then adds an argument why this would not result in abrupt climate change this century.


Sure, but that's just one rather insignificant negative feedback, compared to the many more significant positive feedbacks, such as melting causing isostatic rebound that can contribute to the occurrence of earthquakes and landslides, in turn triggering methane release. Yet, without even mentioning these positive feedbacks, the paragraph then jumps to the following conclusion:


If these initial estimates are not insignificant and if it's all rather difficult to formally assess, how then is it possible that the IPCC reached its end-conclusion with such high confidence? Moreover, was there any basis for these "initial estimates"? Perhaps there's more elsewhere in the IPCC documents. Here's another paragraph that preceeded the above.


All this expresses is low confidence in existing modeling and lack of understanding of the various processes. Again, how then is it possible that the IPCC reached its conclusion with such high confidence?

How much methane is currently released from hydrates?

On this, the IPCC says:


OK, so things could become scary. And sure, there are no large abrupt releases taking place now, but that doesn't mean there's not going to be any in future. In case of gradual processes, it makes sense to base projections on historic releases. In case of abrupt releases, however, current releases should not be the basis for reaching a conclusion with high confidence.

So, was the work of Dr. Natalia Shakhova perhaps used as the basis for these estimates? Read on!

How much methane is stored under the Arctic Ocean?

How much methane is present in sediments under the seabed of the Arctic Ocean, in the form of free gas and hydrates? On this, the IPCC says in FAQ6:


That doesn't seem to reflect the estimates of Dr. Natalia Shakhova. According to older estimates, the total amount of methane in the atmosphere is about 5 Gt. Saying that more than 50 Gt of methane could be stored in hydrates the Arctic seems deceptive and appears to be seriously downplaying a very dangerous situation.

Natalia Shakhova et al. in 2010 estimated the accumulated potential for the East Siberian Arctic Shelf (ESAS) region alone (image on the right) as follows:
  • organic carbon in permafrost of about 500 Gt
  • about 1000 Gt in hydrate deposits
  • about 700 Gt in free gas beneath the gas hydrate stability zone.
Back in 2008, Natalia Shakhova et al. considered release of up to 50 Gt of predicted amount of hydrate storage as highly possible for abrupt release at any time. Did the IPCC perhaps misread the figures, mistaking the part of the methane that is ready for abrupt release for the total amount of methane in the Arctic?

How long could it take for large amounts of methane to reach the atmosphere?

How long could it take for large amounts to reach the atmosphere? On this, the IPCC says in FAQ6, in the same and the next paragraph:


Events in which most, if not virtually all methane that escaped from the seabed did enter the atmosphere have been studied in 2002 and published in 2006, as reported at:
http://www.ia.ucsb.edu/pa/display.aspx?pkey=1482
and at:
http://onlinelibrary.wiley.com/doi/10.1029/2005GB002668/abstract

Below, a screenshot from an interview of John Mason with Natalia Shakhova, published at:
http://www.skepticalscience.com/arctic-methane-outgassing-e-siberian-shelf-part2.html


In conclusion, Dr Natalia Shakhova also rejects the idea that methane release from hydrates always takes place gradually, over a long time. Especially in the Arctic, there's a huge danger of abrupt release, given the accelerated warming that takes place in the Arctic, given the huge amounts of methane stored in sediments in the form of free gas and methane, given the presence of a tectonic fault line, etc, etc.

Once released, methane won't get broken down easily in the Arctic Ocean, as this requires the presence of bacteria that can oxidize the methane, as well as free oxygen in the water. Once depleted, oxygen isn't quickly replenished in the Arctic Ocean. Lack of bacteria and depletion of oxygen in the waters of the Arctic Ocean could prevent oxidation of methane rising up in the waters, as described at:
http://methane-hydrates.blogspot.com/2012/03/large-areas-of-open-ocean-starved-of.html

In the Arctic, low temperatures mean there are less bacteria that need more time to break down the methane. In other places, currents may bring bacteria back to the location of the methane plume repeatedly. In the Arctic, many currents are long, so once bacteria have flowed away from the location of the plume, they could be driven out of the Arctic Ocean or may return only after a long time, i.e. too long to survive in Arctic waters which are cold and often ice-covered, so a lot of time little or no sunshine penetrates the waters.

In the Arctic, the danger is much larger that methane releases will overwhelm the capacity of bacteria to break it down in the water. In case of large abrupt releases in the Arctic, the danger is that much of the methane will reach the atmosphere unaffected and remain there for a long time, due to the Jet Stream and the low levels of hydroxyl in the Arctic atmosphere, as further described at:
http://methane-hydrates.blogspot.com/2013/04/methane-hydrates.html

BTW, how did all this methane manage to reach the atmosphere over the Arctic Ocean? 

Methane levels over the Arcic Ocean appear to be rising, as illustrated by the combination of images below, showing methane levels over five years (2009 on the left, to 2013 on the right), each time for the same period (January 21-31) - images by Dr. Leonid Yurganov.

[ Click on image to enlarge - from: Dramatic increase in methane in the Arctic in January 2013 ]
If the IPCC was right, how then was it possible methane levels to rise so sharply and abruptly. How was it possible for large amounts of methane to be present over the deep waters of the Arctic Ocean, as discussed at:
http://arctic-news.blogspot.com/2013/10/methane-over-deep-waters-of-arctic-ocean.html

[ How did this methane get there? - click on image to enlarge - see also: Methane over deep waters of Arctic Ocean ]
There is a wealth of evidence from scientists such as Igor Semiletov and Natalia Shakhova who have - year after year - been taking measurements in the East Siberian Arctic Shelf, complete with first-hand reports that methane plumes have been detected.

"We've found continuous, powerful and impressive seeping structures more than 1,000 metres in diameter. In a very small area, less than 10,000 square miles, we have counted more than 100 fountains, or torch-like structures, bubbling through the water column and injected directly into the atmosphere from the seabed," Dr Semiletov said, "We carried out checks at about 115 stationary points and discovered methane fields of a fantastic scale - I think on a scale not seen before. Some of the plumes were a kilometre or more wide and the emissions went directly into the atmosphere - the concentration was a hundred times higher than normal."  -  Vast methane 'plumes' seen in Arctic ocean as sea ice retreats, by Steve Connor in The Independent, December 13, 2011.

The image below shows a cluster of methane plumes, over one km in diameter, that appeared in the Laptev Sea end September 2011. The image is part of a paper on the unfolding "Methane Catastrophe".


Of course, we all wished that we're wrong about this terrifying Arctic methane threat, but the precautionary principle demands a thorough investigation of observations that appear to be at odds with wishful thinking, especially when the stakes are so high. So, IPCC, where's the evidence?


Related

- Arctic Methane Monster
http://arctic-news.blogspot.com/2013/09/arctic-methane-monster.html

- Methane over deep waters of Arctic Ocean
http://arctic-news.blogspot.com/2013/10/methane-over-deep-waters-of-arctic-ocean.html

- Methane hydrate myths
http://methane-hydrates.blogspot.com/p/myths.html

- Methane hydrates
http://methane-hydrates.blogspot.com/2013/04/methane-hydrates.html

- Methane release caused by earthquakes
http://arctic-news.blogspot.com/2013/09/methane-release-caused-by-earthquakes.html

- Earthquake hits Laptev Sea
http://arctic-news.blogspot.com/2013/09/earthquake-hits-laptev-sea.html

- North Hole
http://arctic-news.blogspot.com/2013/09/north-hole.html

- Seismic activity, by Malcolm Light and Sam Carana (2011)
Arctic-news.blogspot.com/p/seismic-activity.html

- Thermal expansion of the Earth's crust necessitates geoengineering (2011)
Arctic-news.blogspot.com/p/thermal-expansion.html

Monday, July 15, 2013

Comprehensive and Effective Climate Plan

President Obama's Climate Action Plan doesn't look much like a shift to genuinely clean energy. As discussed in a recent post by Peter Carter, the President's Plan sadly supports fossil fuel in many ways.

The plan supports natural gas very prominently. Indeed, how clean is natural gas? Years ago, a Cornell University study (image below) concluded that emissions caused by natural gas can be even worse than coal and diesel oil, especially when looked at over a relatively short period.


At the time, I wrote that this kind of support for natural gas - as if that was supposedly "clean energy" - would only perpetuate the government's support for fuel, while doing little or nothing to help genuinely clean energy. Moreover, continued support for fossil fuel comes at the expensive of growth in genuinely clean energy that we need instead.

EIA figures also show that, over the period from 1990 to 2010, the average amount of carbon dioxide produced in the United States for each unit of energy generated has remained much the same as the world average, while the situation in China has grown even worse.


IEA figures further show that the world's energy-related carbon dioxide emissions continue to rise rapidly and that they, for the period 1900 - 2012, add up to a staggering amount of 1257 Gt.


As the image below shows, from a recent IEA report, the carbon intensity of global energy has hardly improved over the decades.


The colored lines on the right correspond with scenarios in which global temperatures are projected to increase by, respectively, 6 degrees Celsius, 4 degrees Celsius and 2 degrees Celsius.

What are the chances that it will be possible to avoid the worst-case scenario?  The IEA elaborates that an extension of current trends would result in an average global temperature rise of at least 6 degrees Celsius in the long term. To have an 80% chance of limiting the average global temperature rise to 2 degrees Celsius, energy-related carbon dioxide emissions need to be cut by more than half in 2050 compared with 2009. They would need to continue to fall thereafter.

While the IEA adds that the goal of limiting the average global temperature rise to 2 degrees Celsius can only be achieved if greenhouse gas emissions in non-energy sectors are also reduced, the IEA does not elaborate on what further action will be needed and whether emission reductions alone will suffice to avoid climate catastrophe.

[click to enlarge]
As said, the world's cumulative energy-related carbon dioxide emissions add up, for the period 1900 - 2012, to a staggering amount of 1257 Gt. As the graph on the right shows, methane's global warming potential for the first decade since its release into the atmosphere will be more than 130 times as much as carbon dioxide.

Abrupt release of just 10 Gt of methane will - during the first decade since entering into the atmosphere - have a stronger greenhouse effect globally than all cumulative energy-related carbon dioxide emissions from 1900 to 2012.

Note that above calculation applies to methane as it's typically released at present, i.e. gradually and spread out over the world, mostly originating from cattle, wetlands, biowaste, energy, forest fires, etc. Things will be much worse in case of abrupt release of methane from the Arctic seabed, when much of the methane will initially remain concentrated in the Arctic, where hydroxyl levels are also very low.

After 5 years, a methane cloud 20% the size of its original abrupt release of methane in the Arctic will still have more than 1000 times the warming potency locally that the same mass of carbon dioxide has globally.


Look at it this way; an abrupt release in the Arctic Ocean will initially remain concentrated locally. The Arctic Ocean covers 2.8% of the Earth's surface, while there's currently about 0.14 Gt of methane in the atmosphere over the Arctic Ocean. Abrupt release of 1 Gt methane from the Arctic seabed will thus initially multiply methane levels in the atmosphere over the Arctic Ocean by 8, trapping much more heat from sunlight, especially during the June solstice when solar radiation received by the Arctic is higher than anywhere else on Earth.

This comes on top of warming that is already accelerated in the Arctic. Albedo changes alone could cause more warming than all emissions by people globally, according to calculations by Prof. Peter Wadhams, who also describes things in the video below.


The resulting temperature rises in the Arctic threaten to trigger further methane releases from the seabed and wildfires on land in the Arctic, further driving up temperatures in an exponential spiral of runaway global warming.

In conclusion, what's needed is a climate plan that will genuinely produce the necessary action, i.e. a comprehensive and effective climate plan as described at
https://arctic-news.blogspot.com/p/climateplan.html


Monday, January 28, 2013

Further feedbacks of sea ice decline in the Arctic

Arctic sea ice currently acts as a shield, preventing methane from entering the atmosphere, concludes a study by researchers from two Chinese scientific institutes

The researchers observed more methane in the water under the sea ice than the methane in the air above the sea ice. They conclude that the sea ice collects and holds the methane in places close enough to the surface for the methane to be consumed through photochemical and biochemical oxidation. In other words, sufficient light can reach the spots where methane assembles underneath the ice for the methane to get consumed by biological processes.

Change of CH4 mixing ratio over time in the chamber on under-ice water. In CBS1–CBS3, CH4mixing ratios fluctuated in the first 1–2 h and then increased, suggesting significant emission of CH4. No increasing trend in CBS4 might due to the relatively short sampling time (only 2 h) during which CH4mixing ratio had not started increasing.
A study by the Alfred Wegener Institute led by Marcel Nicolaus has found that where melt water collects on the ice, far more sunlight and therefore energy is able to penetrate the ice than is the case for white ice without ponds. The consequence is that the ice is absorbing more solar heat, is melting faster, and more light is available for the ecosystems in and below the ice.

As the sea ice has decreased in volume over the years, there now is mainly thin, first-year ice, extensively covered with melt ponds in the summer months, where once metre-thick, multi-year ice used to be. Additionally, the melt ponds have a different color, causing further albedo change. “Their colour depends entirely on how thick the remaining ice below the melt pond is and the extent to which the dark ocean beneath can be seen through this ice. Melt ponds on thicker ice tend to be turquoise and those on thin ice dark blue to black”, explains Dr. Marcel Nicolaus, sea ice physicist and melt pond expert at the Alfred Wegener Institute.

Graphic depiction of the amount of sunlight above and underneath the Arctic sea ice. The growing coverage of the ice by darker meltponds increases the share of sunlight, which passes the sea ice. That means, the space underneath the ice becomes brighter and warmer. Furthermore less sunlight is refleced back into the atmosphere. Graphic: Marcel Nicolaus/Yves Nowak, Alfred Wegener Institute
Marcel Nicolaus explains: “The young thin ice with the many melt ponds does not just permit three times as much light to pass through than older ice. It also absorbs 50 per cent more solar radiation. This conversely means that this thin ice covered by melt ponds reflects considerably fewer sun rays than the thick ice. Its reflection rate is just 37 per cent. The young ice also absorbs more solar energy, which causes more melt. The ice melts from inside out to a certain extent,” says Marcel Nicolaus.

Marcel Nicolaus adds: “The greater the share of one-year ice in the sea ice cover, the more melt ponds will form and the larger they will be. This will also lead to a decreasing surface albedo (reflectivity) and transmission into the ice and ocean will increase. The sea ice will become more porous, more sunlight will penetrate the ice floes, and more heat will be absorbed by the ice. This is a development which will further accelerate the melting of the entire sea ice area.”

These studies contain an important warning. As the sea ice gets thinner, more sunlight and therefore energy is penetrating the ice and getting absorbed. Initially, this will increase the growth of bacteria that break down methane collecting underneath the sea ice. Eventually however, as sea ice retreats further, there will be less opportunities for methane to be held underneath the sea ice and broken down by bacteria. Instead, more methane will then enter the atmosphere unaffected.

These are further feedbacks of sea ice retreat, in addition to the many feedbacks described in the Diagram of Doom. Sea ice is declining at exponential pace. The big danger is that a huge rise of temperatures in the Arctic will destabilize huge amounts of methane currently held in the seabed. Comprehensive and effective action is needed now to avoid catastrophe.

References

- Sea ice in the Arctic Ocean: Role of shielding and consumption of methane - Xin He et al.
http://dx.doi.org/10.1016/j.atmosenv.2012.10.029

Melt ponds cause the Artic sea ice to melt more rapidly - Alfred Wegener Institute news release

- Changes in Arctic sea ice result in increasing light transmittance and absorption - Marcel Nicolaus et al. DOI: 10.1029/2012GL053738

Tuesday, August 28, 2012

Diagram of Doom


Above diagram was part of a poster displayed at the 2011 AGU meeting in San Francisco by the Arctic Methane Emergency Group (AMEG). It was accompanied by the following text: In the Arctic, three problems are compounding one another: emissions causing global warming, sea ice loss causing accelerated warming, and methane releases further accelerating Arctic warming, with the danger of triggering runaway global warming.

The diagram pictures three kinds of warming and their main causes:
  1. Emissions by people causing global warming, with temperatures rising around the globe, including the Arctic.
  2. Soot, dust and volatile organic compounds settling down on snow and ice, causing albedo change. More heat is absorbed, rather than reflected as was previously the case. This causes accelerated warming in the Arctic.
  3. Accelerated warming in the Arctic threatening to weaken methane stores in the Arctic with the danger that methane releases will trigger runaway global warming.

The diagram also pictures two feedback effects that make things even worse:
  • Albedo feedback: Accelerated warming in the Arctic speeds up sea ice loss, further accelerating albedo change.
  • Methane feedback: Methane releases in the Arctic further add to the acceleration of warming in the Arctic, further contributing to weaken Arctic methane stores and increasing the danger that methane releases will trigger runaway global warming.

Albedo change in the Arctic comprises a number of elements, as depicted in the image below, from the 2004 report Impacts of a Warming Arctic - Arctic Climate Impact Assessmentby the International Arctic Science Committee.  


As described in various posts at this blog over time, there are further points that should be taken into account. Regarding sea ice loss, it's clear that where sea ice retreats, more open water appears, with the result that less sunlight is reflected back into space. Accelerated warming will also affect the integrity of the remaining sea ice, as well as of the snow and ice cover on land, including glaciers. This further adds to the albedo effect, causing less sunlight to be reflected back into space. Similarly, further feedbacks could be added or described in more detail.

Accordingly, ten feedbacks can be identified, and described as follows:
  1. Albedo feedback: Accelerated warming in the Arctic speeds up the decline of ice and snow cover, further accelerating albedo change. 
  2. Methane feedback: Methane releases in the Arctic further add to the acceleration of warming in the Arctic, further contributing to weaken Arctic methane stores and increasing the danger that methane releases will trigger runaway global warming. 
  3. Currents feedback: Sea ice loss can cause vertical sea currents to weaken, reducing the cooling effect they had on the seabed. This can thus further cause sediments to warm up that can contain huge amounts of methane in the form of free gas and hydrates. 
  4. Storms feedback: Increased frequency and intensity of storms can cause substantially more vertical mixing of the sea water column, causing more warming of the seabed, thus further contributing to the warming of sediments, as above. 
  5. Storms feedback: Accelerated warming in the Arctic can result in more storms, causing mixing of cold Arctic air with warmer air from outside the Arctic. The net result is a warmer Arctic. 
  6. Storms feedback: More open waters can result in more storms that can push the ice across the Arctic Ocean, and possibly all the way out of the Arctic Ocean. 
  7. Storms feedback: Storms also cause more waves that break up the sea ice. Smaller pieces of ice melt quicker than large pieces. A large flat and solid layer of ice is also less susceptible to wind than many lighter and smaller pieces of ice that will stand out above the water and capture the wind like the sails of yachts. 
  8. Storms feedback: Storms cause waters to become more wavy. Calm waters can reflect much sunlight back into space, acting as a mirror, especially when the sun shines under a low angle. Wavy waters, on the other hand, absorb more sunlight. 
  9. Fires feedback: More extreme weather comes with heatwaves and storms. Thus, this is in part another storms feedback. The combination of storms and fires can be deadly. Heatwaves can spark fires that, when fueled up by storms, turn into firestorms affecting huge areas and causing huge amounts of emissions. Storms can whip up particles that when deposited on ice, snow or the bare soil, can cause more sunlight to be absorbed. 
  10. Open doors feedback: Accelerated warming in the Arctic causes the polar vortex and jet stream to weaken, causing more extreme weather and making it easier for warm air to enter the Arctic.

These ten feedback are depicted in the diagram below.